
New normal: Tight credit conditions, high funding costs, and less Fed guidance
Bank and credit union CFOs must navigate a more divided Fed that meets less often, while delinquencies and funding costs remain high.
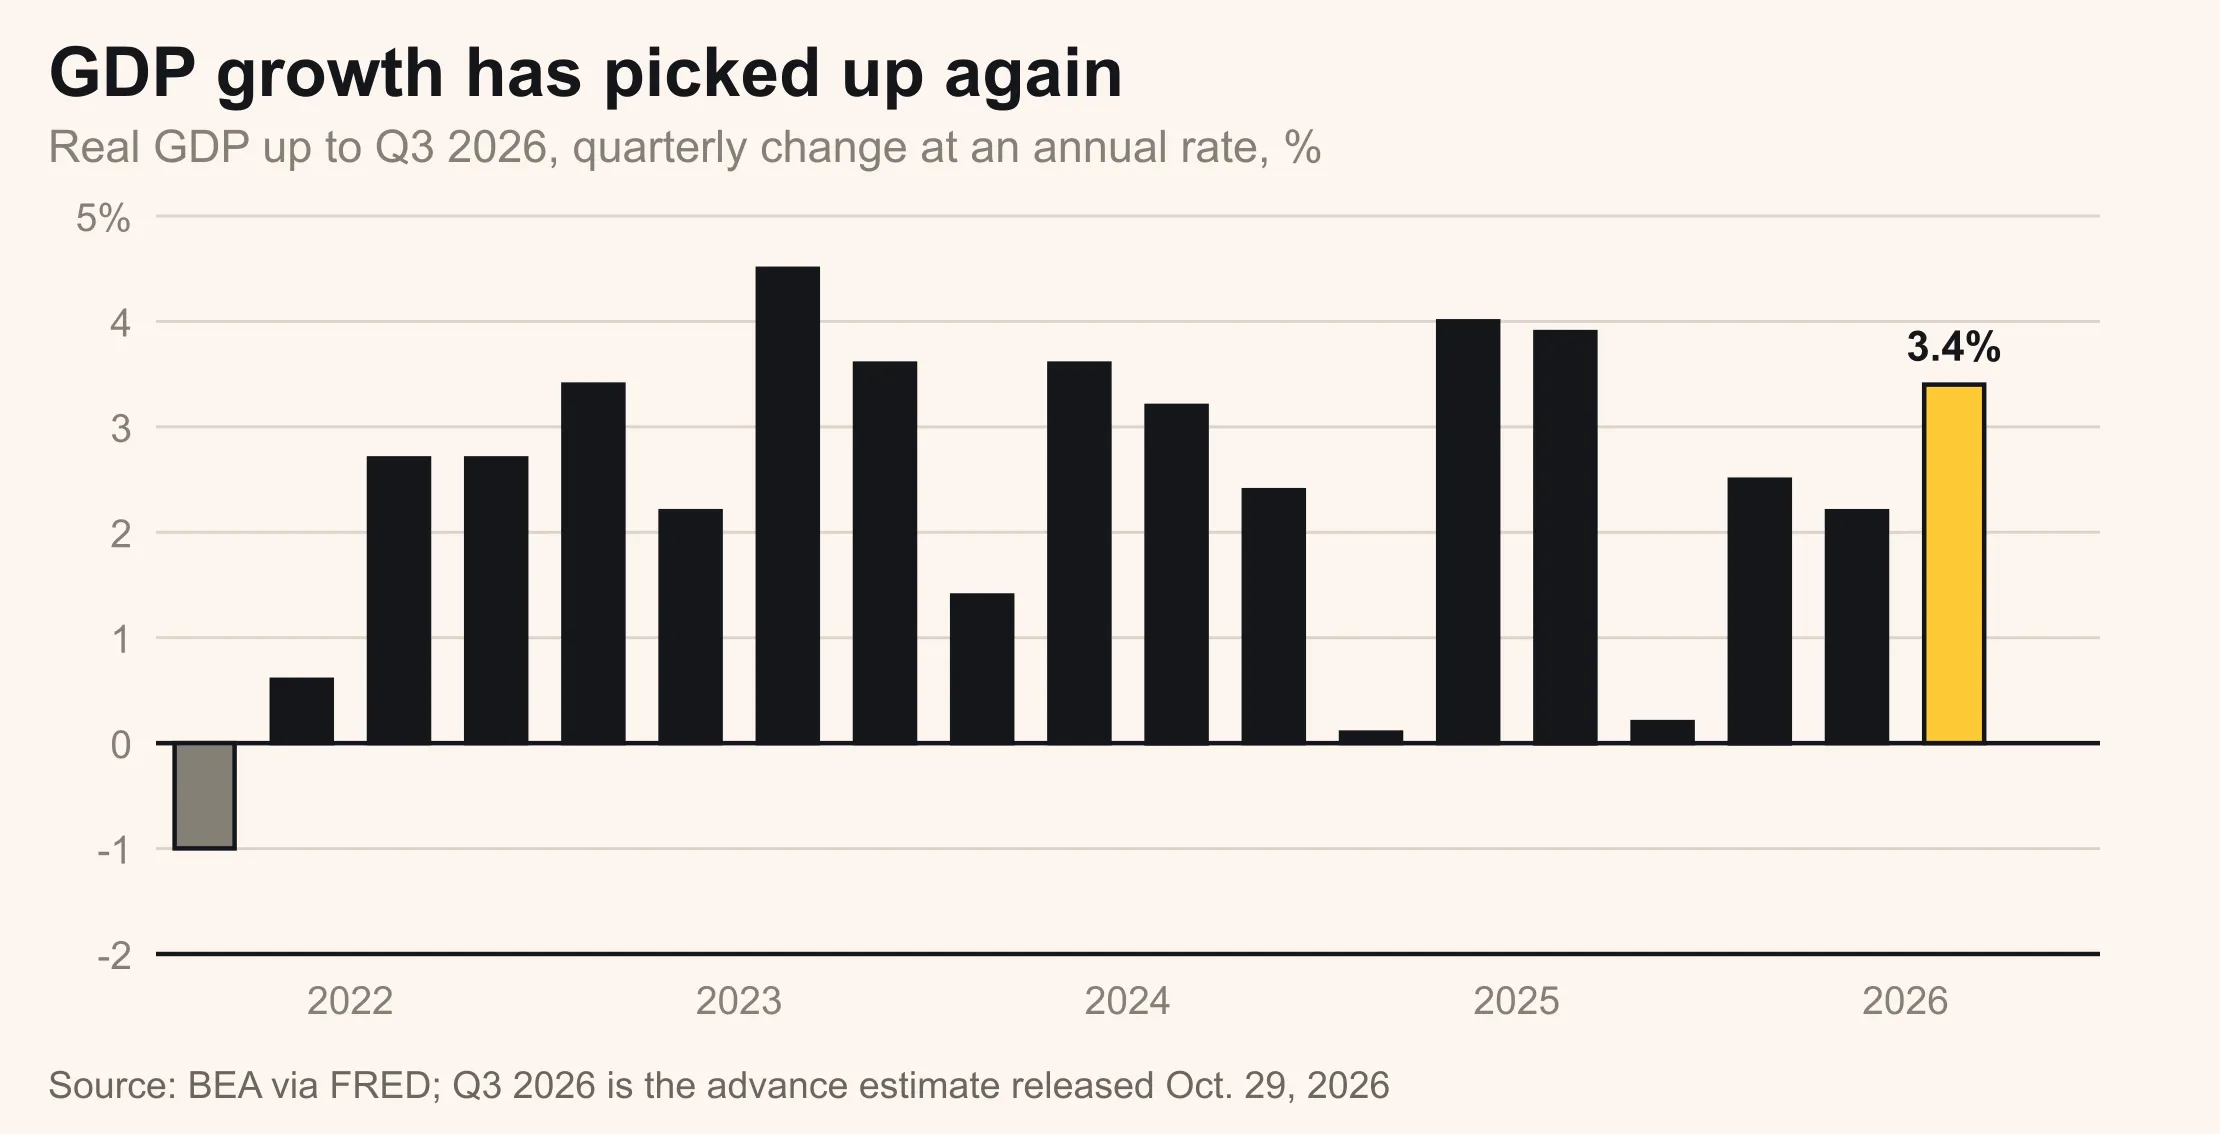
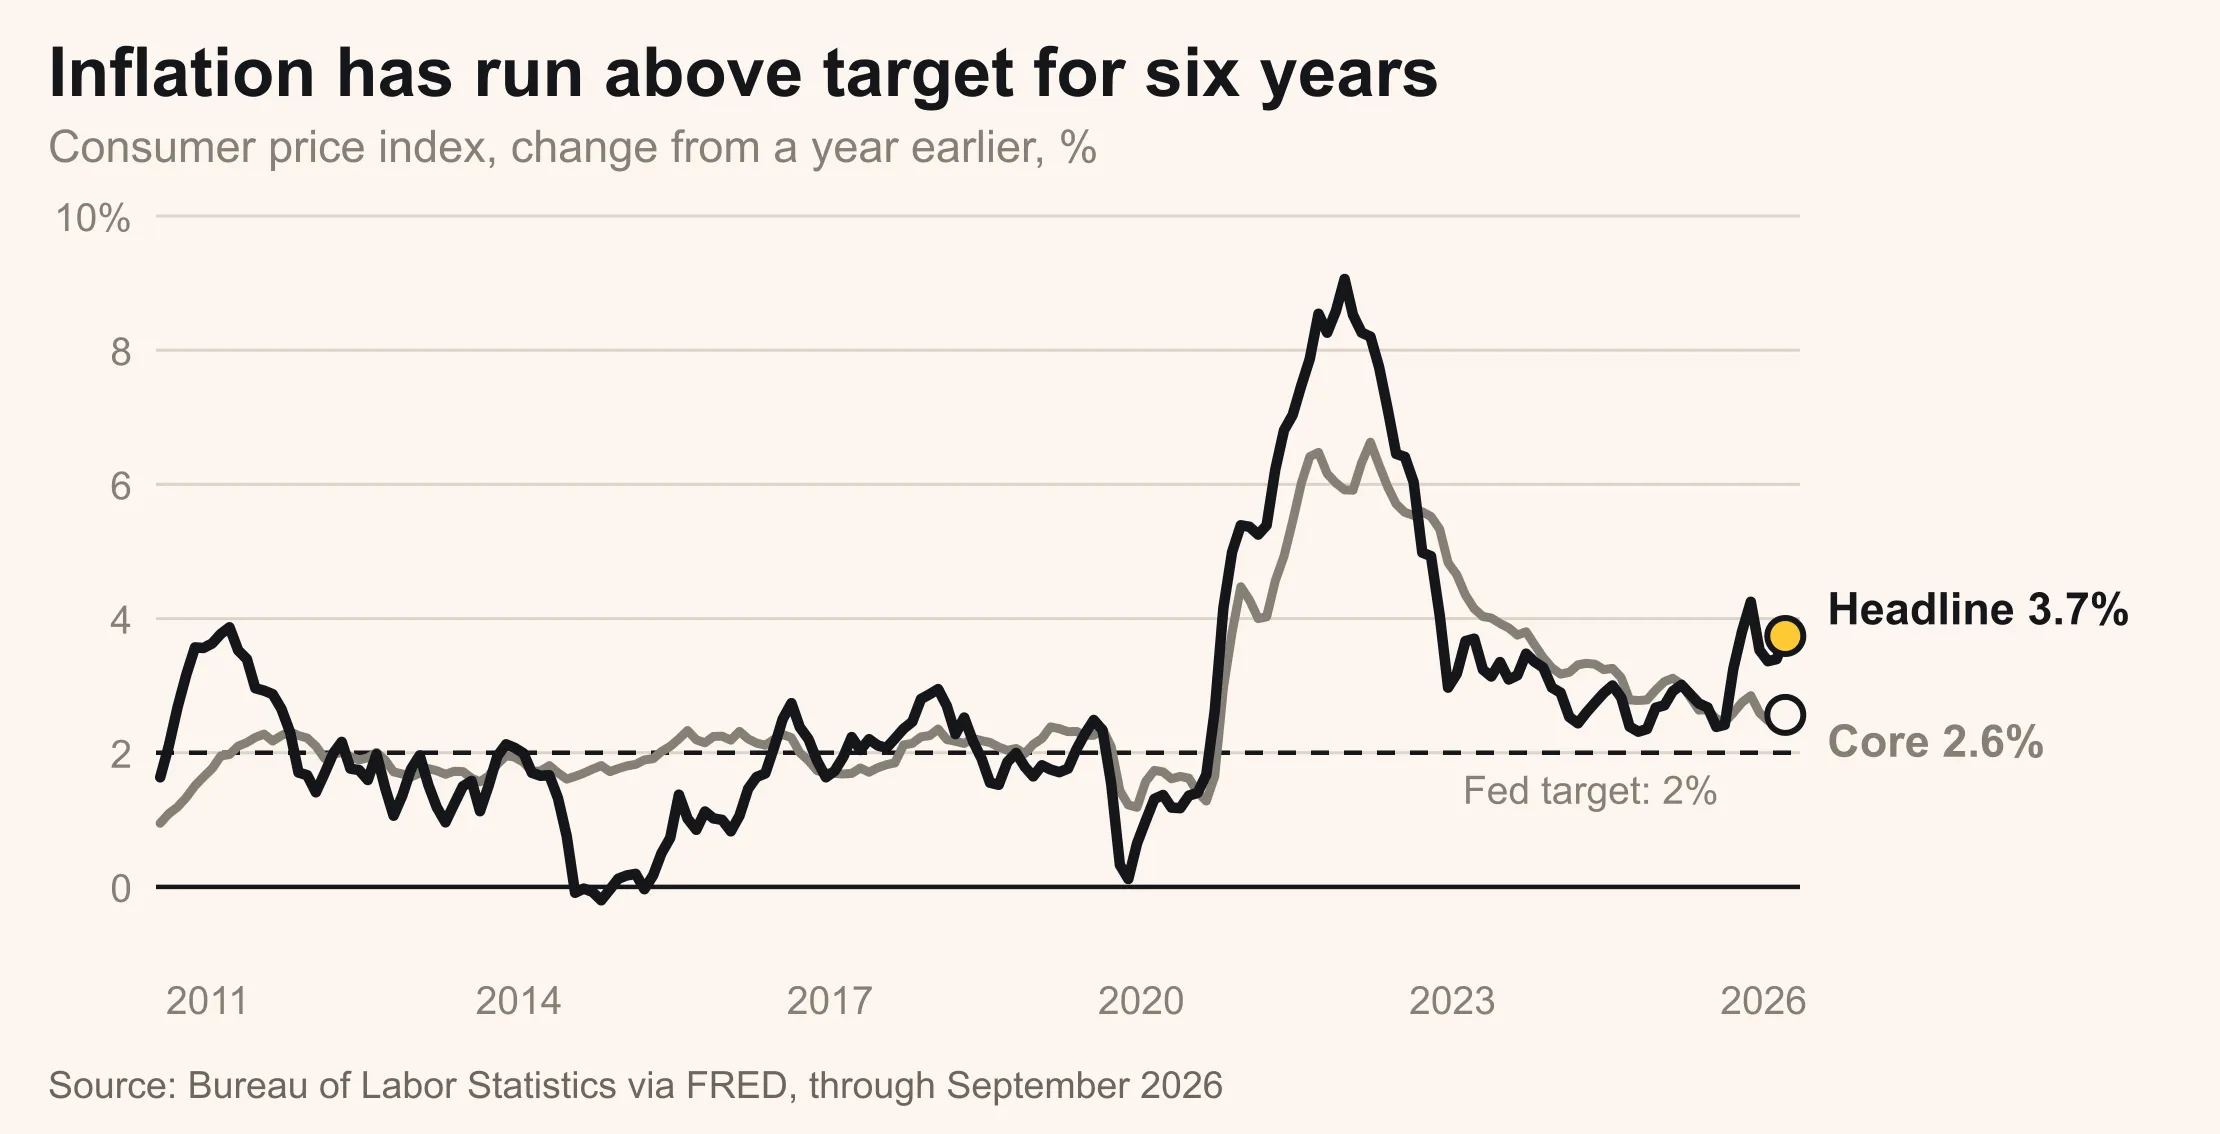
By Alexander Demyanets, Chief Economist··3 min readThe FOMC held the target fed funds rate at 3.75–4.00% despite a worsening inflation outlook and robust GDP growth numbers.
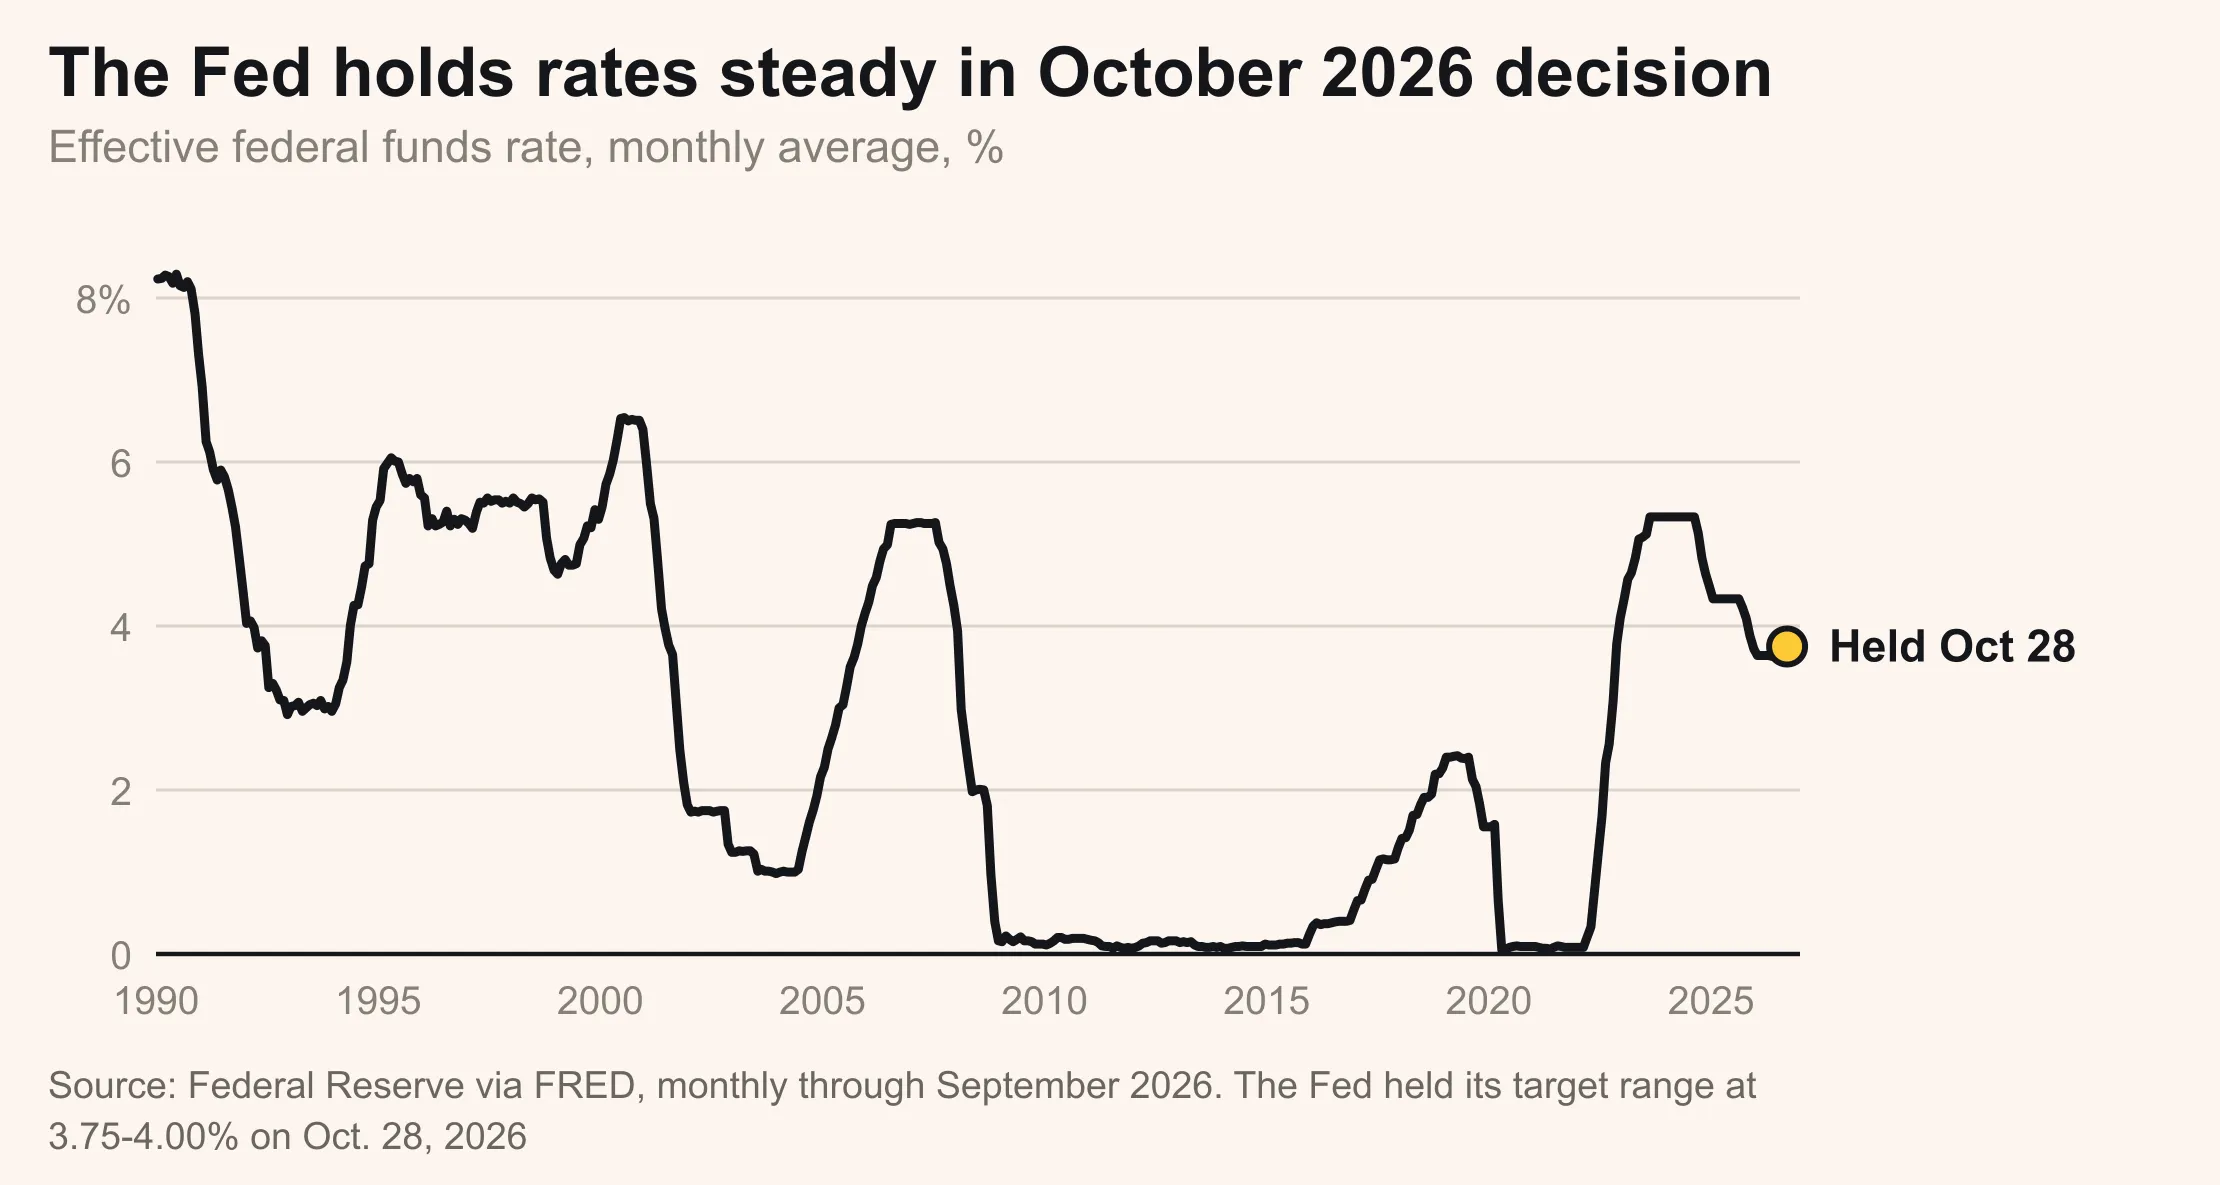
The decision was not unanimous, however, with Governor Lisa Cook and Beth Hammack voting for a quarter point hike, arguing high inflation necessitated a more restrictive policy stance.
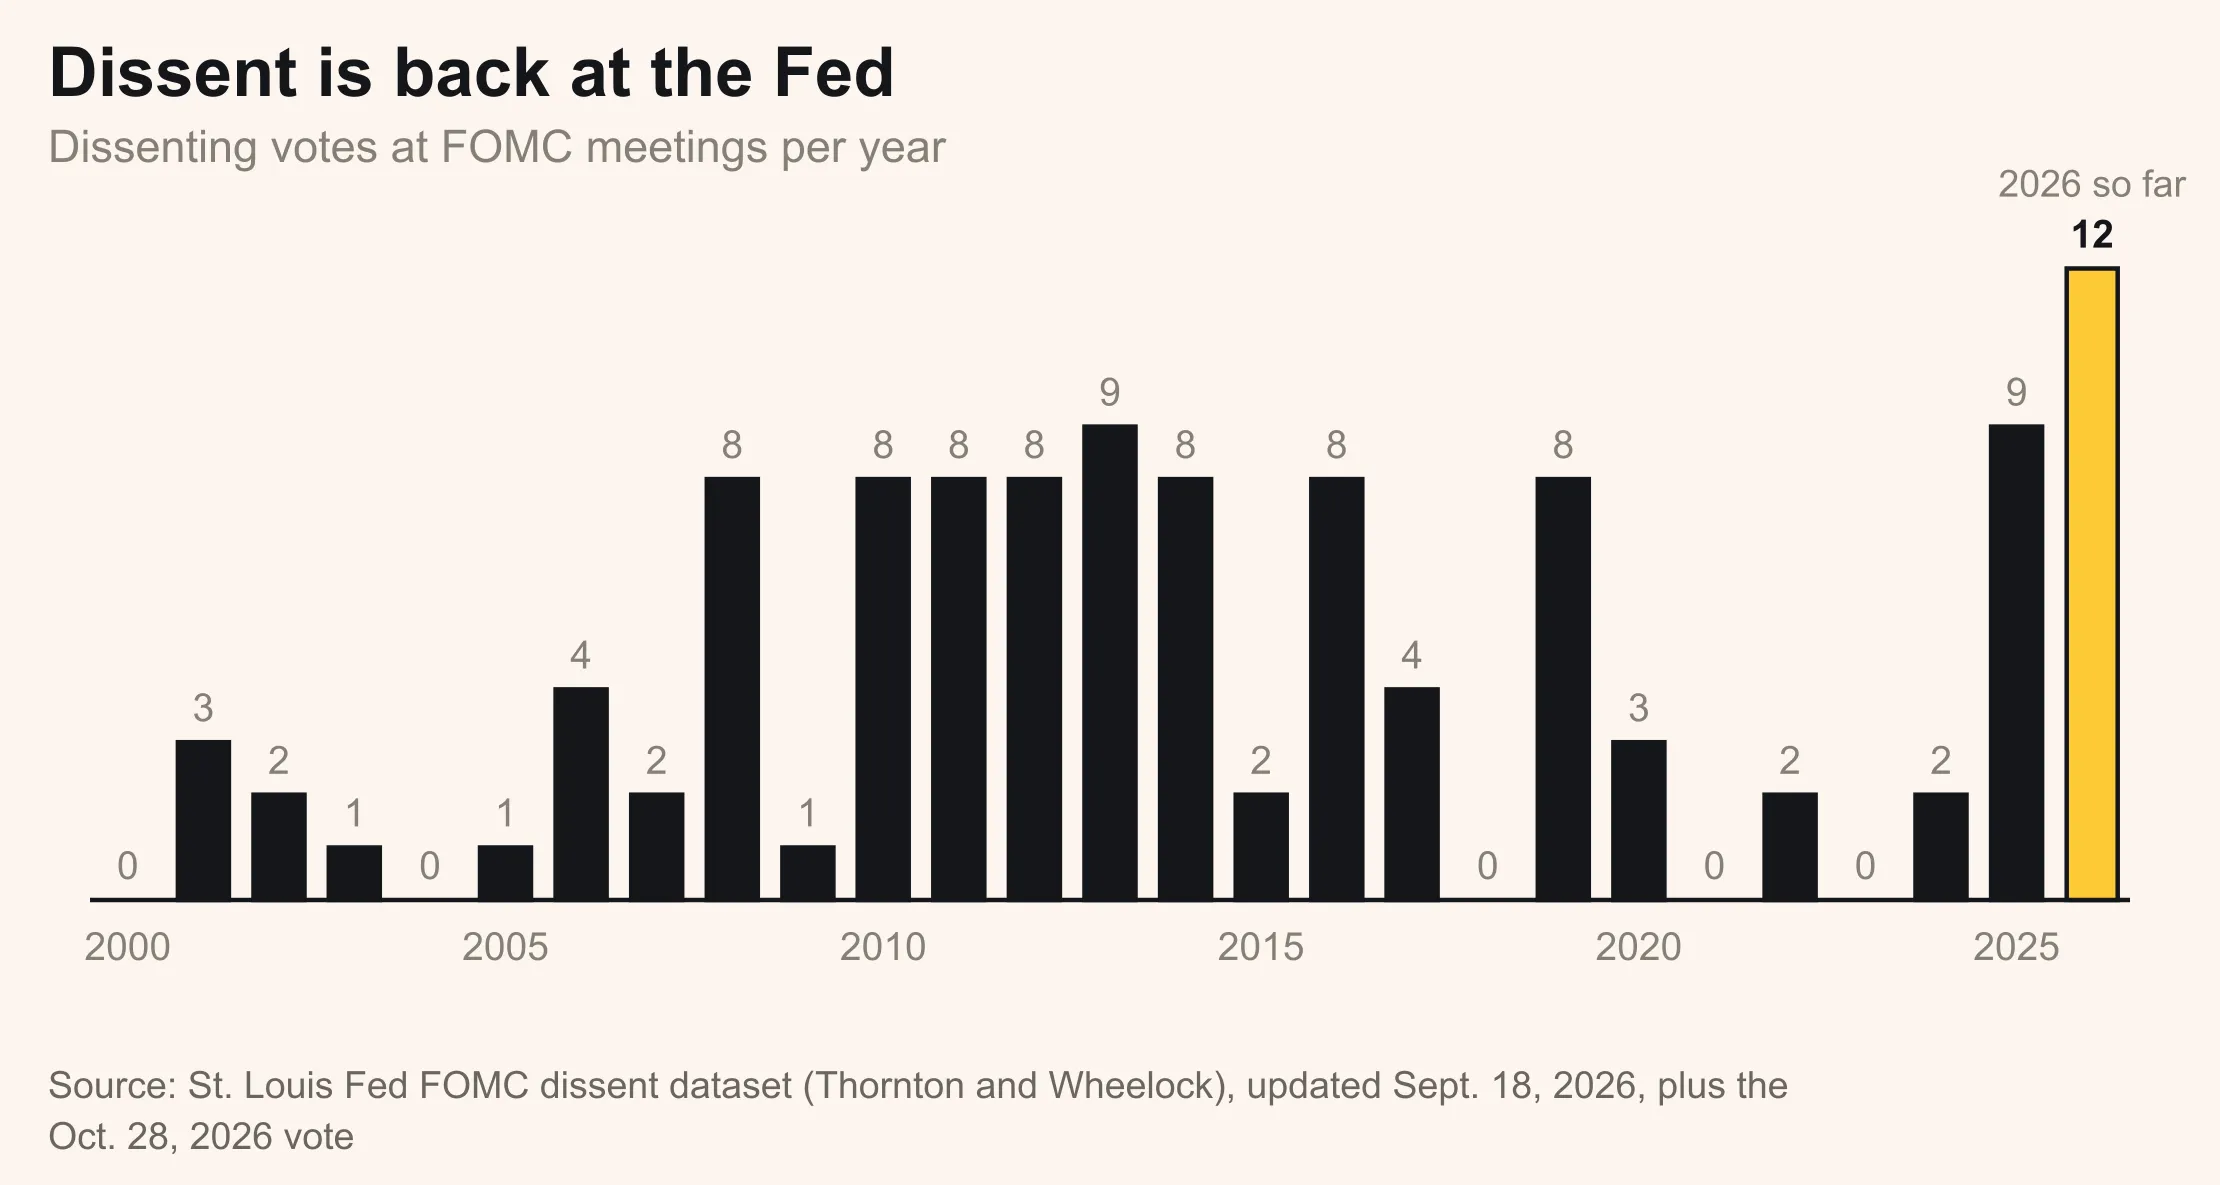
The decision was widely expected so there were no large market moves following the announcement.
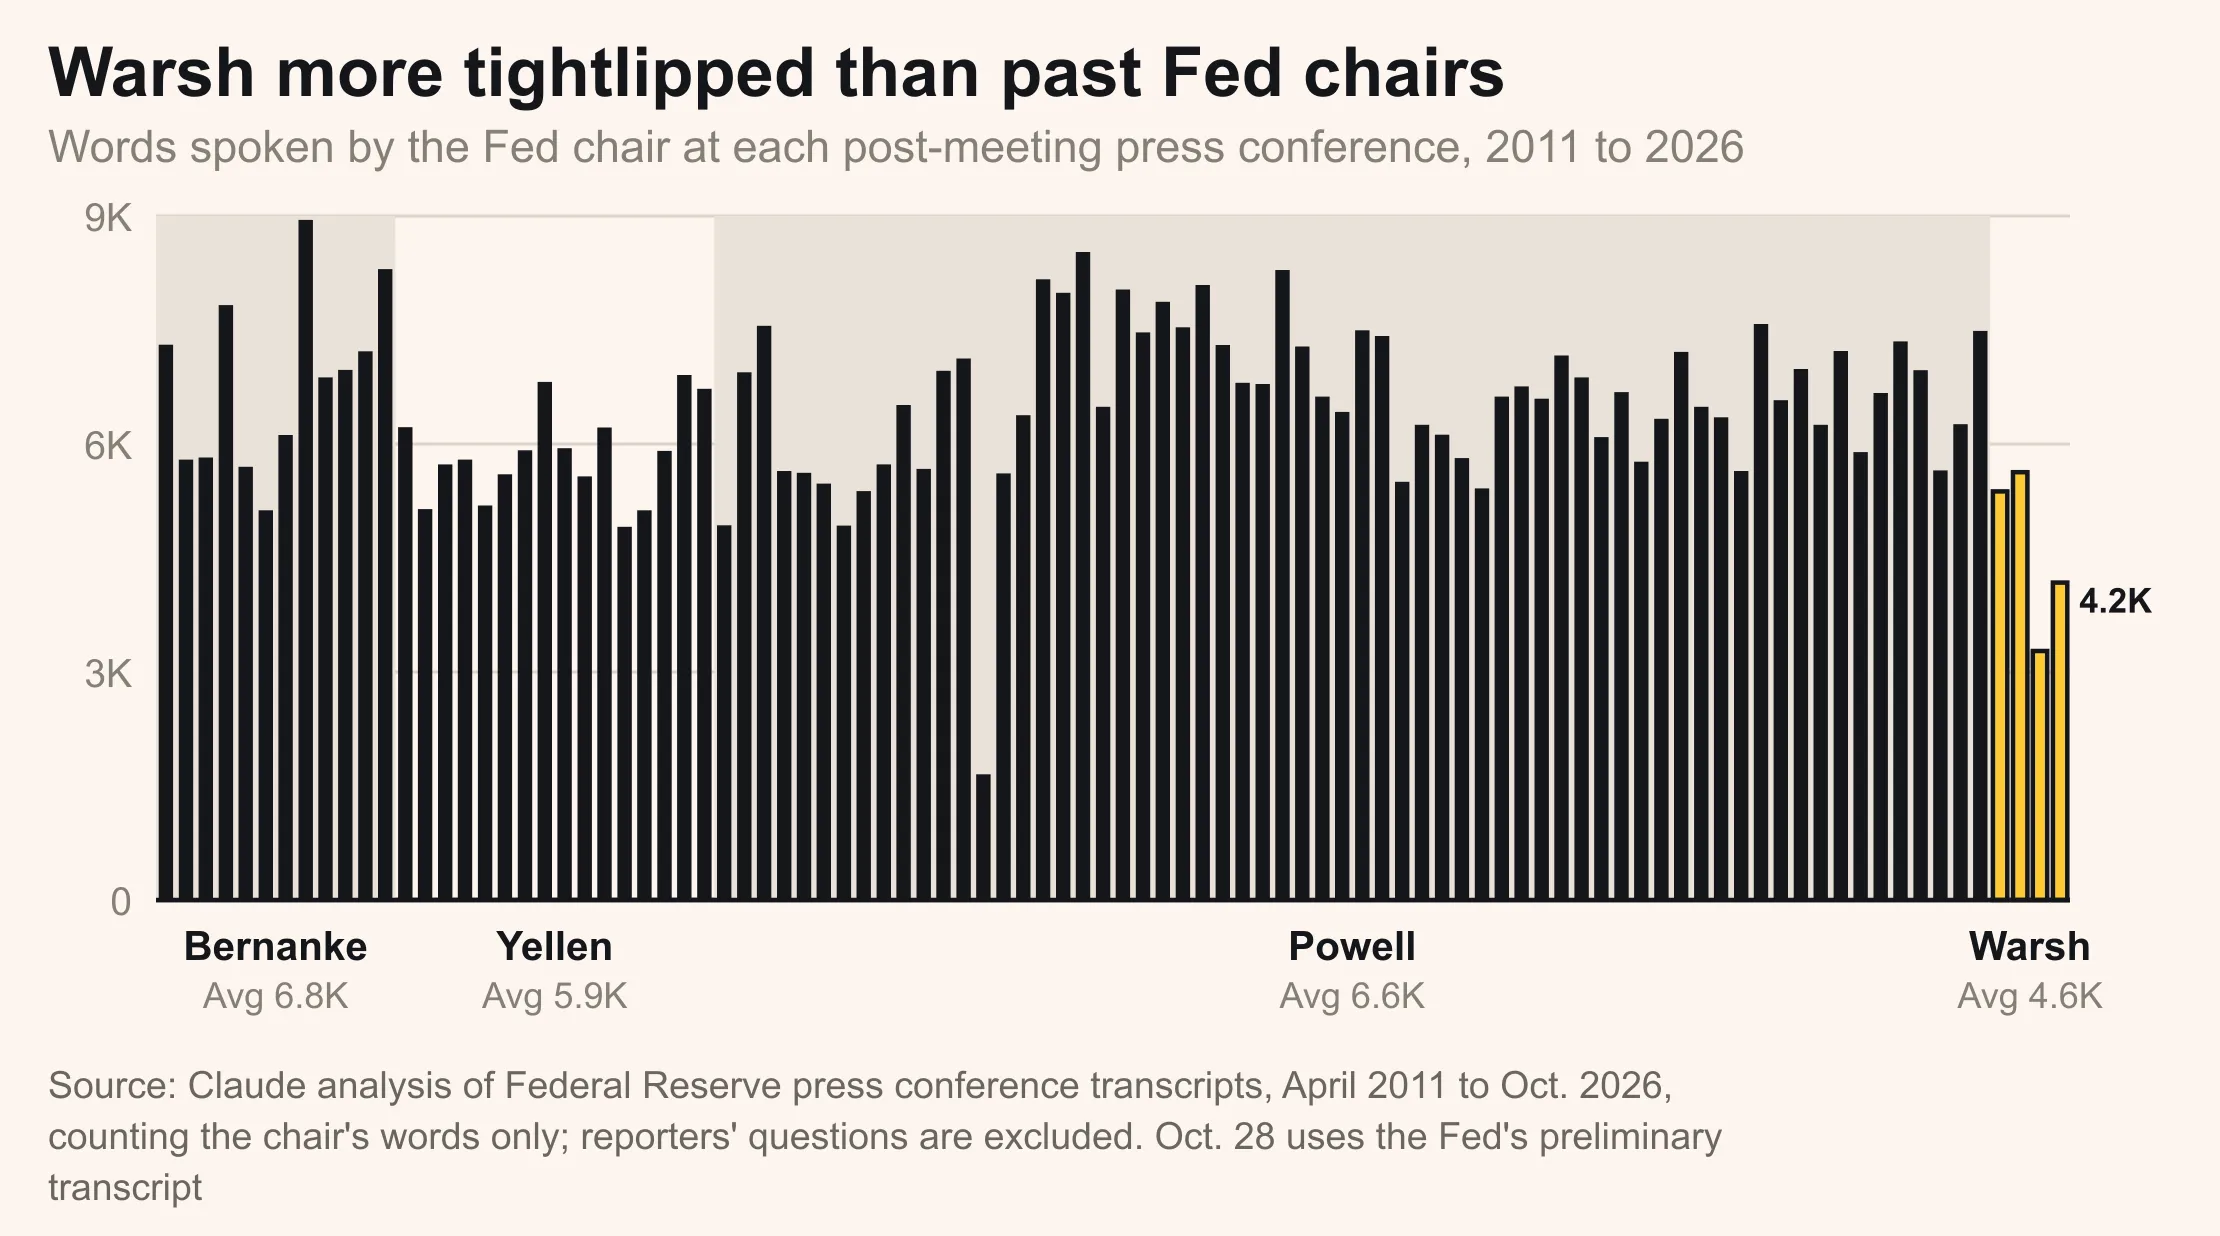
Consistent with his approach of (under)communication, Warsh held a brief press conference that didn’t reveal much news other than the change in the meetings calendar.
Starting from 2027, the number of rate-setting meetings would be cut from 8 to 7 and then further down to 6 in 2028; the remaining meetings will be reserved for “strategy” discussions.
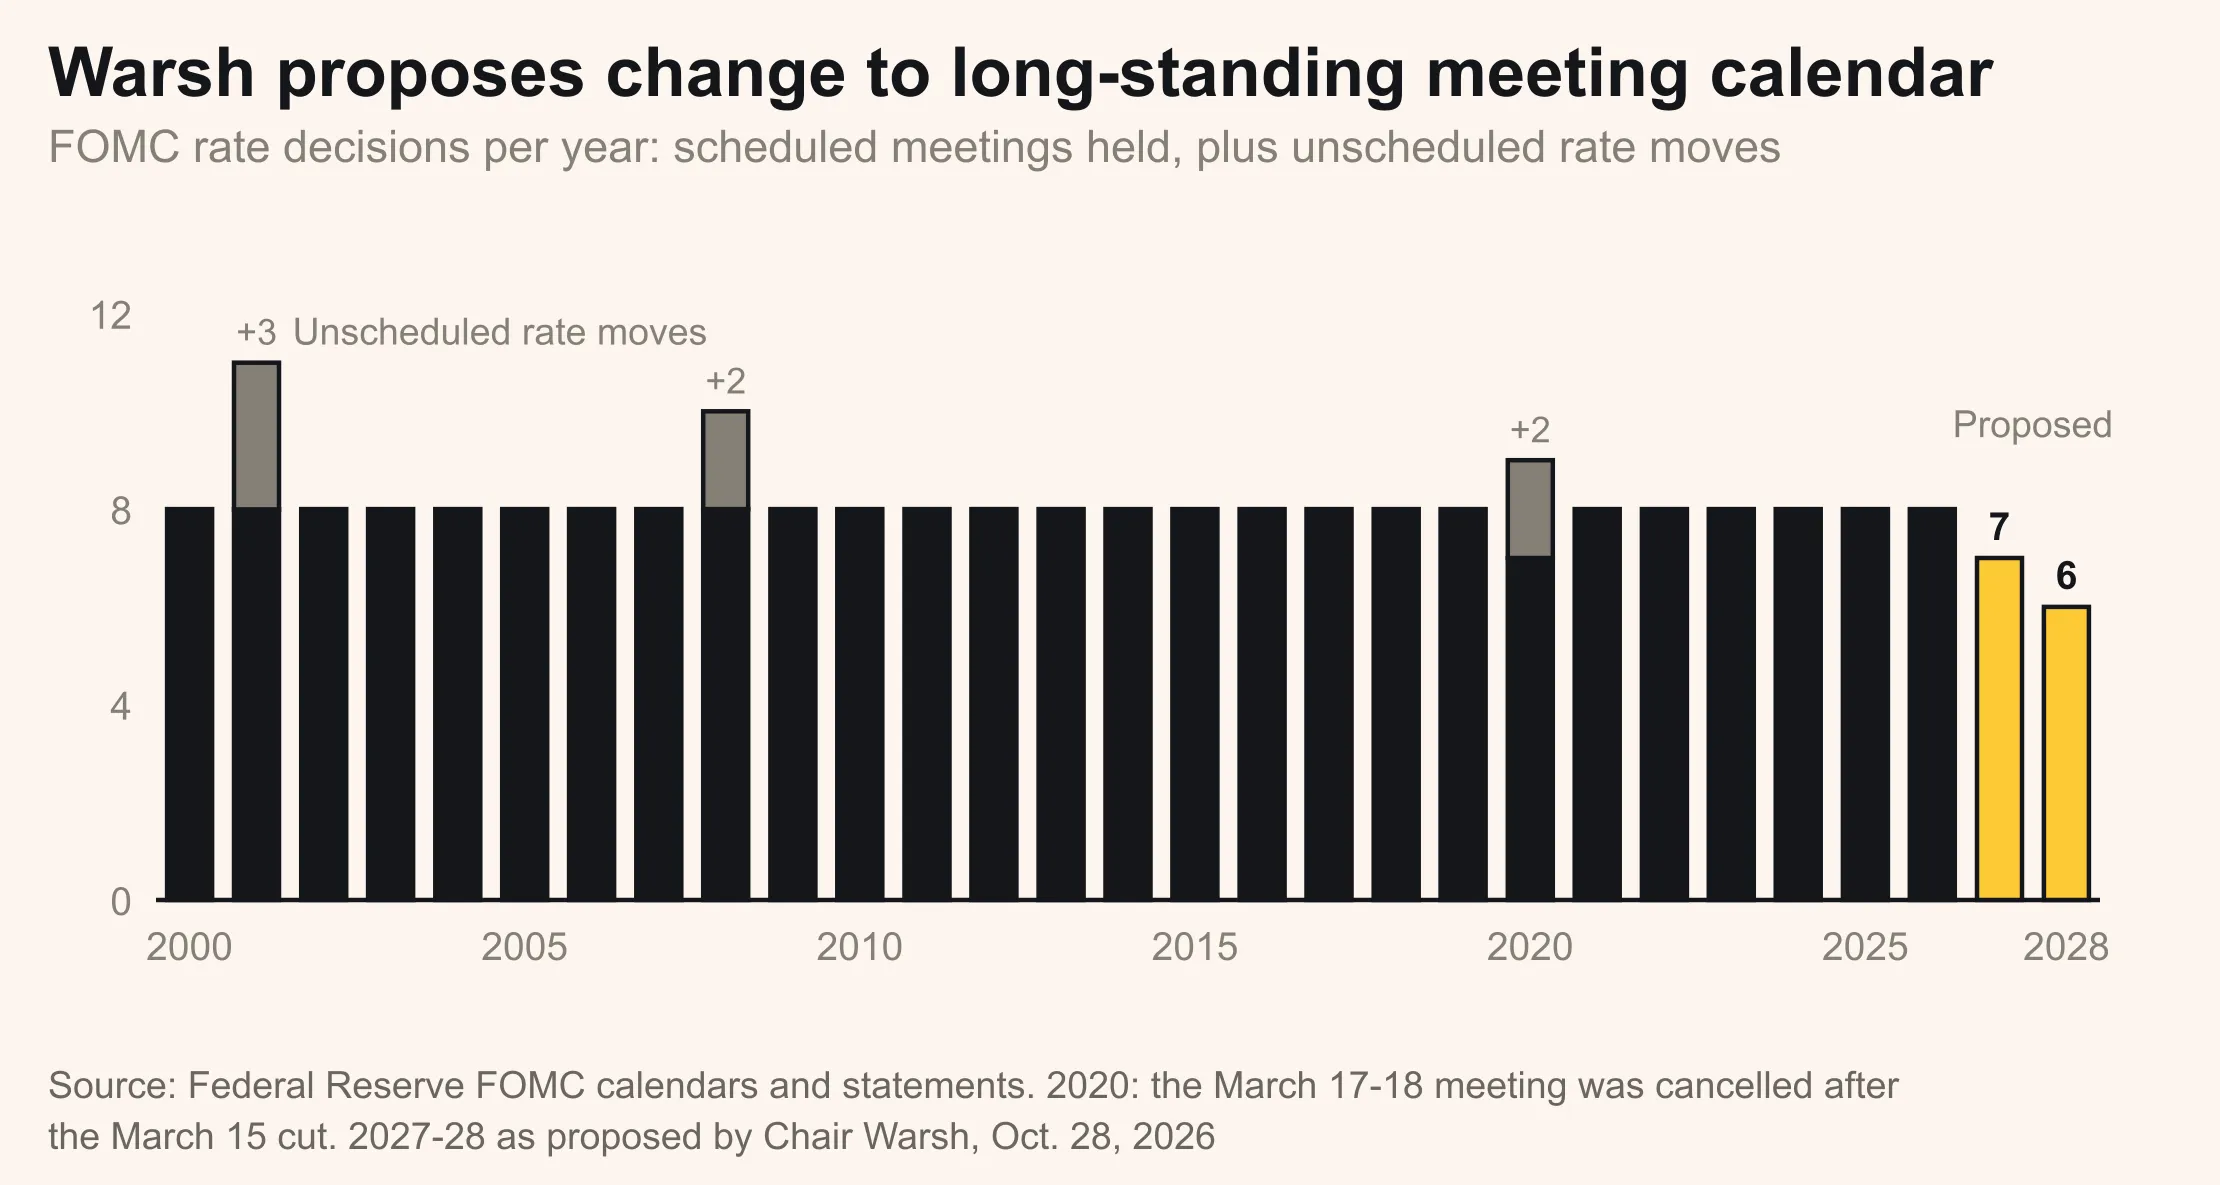
It’s a bold twist in monetary policy strategy at a time of heightened inflation risk: The Warsh Fed believes it will need to fire fewer shots to tame inflation. The Fed officials’ job is going to become harder, and any policy mistakes will have outsized market impact, increasing volatility.
One notable aspect of the press conference was the discussion around credit conditions. While Warsh refused to call credit conditions “tight,” he acknowledged that credit conditions have “tightened for some households and businesses.”
Translating from Fedspeak, many community financial institutions already know this as they see lending growth stalling and loan delinquency rates reaching decade-highs.
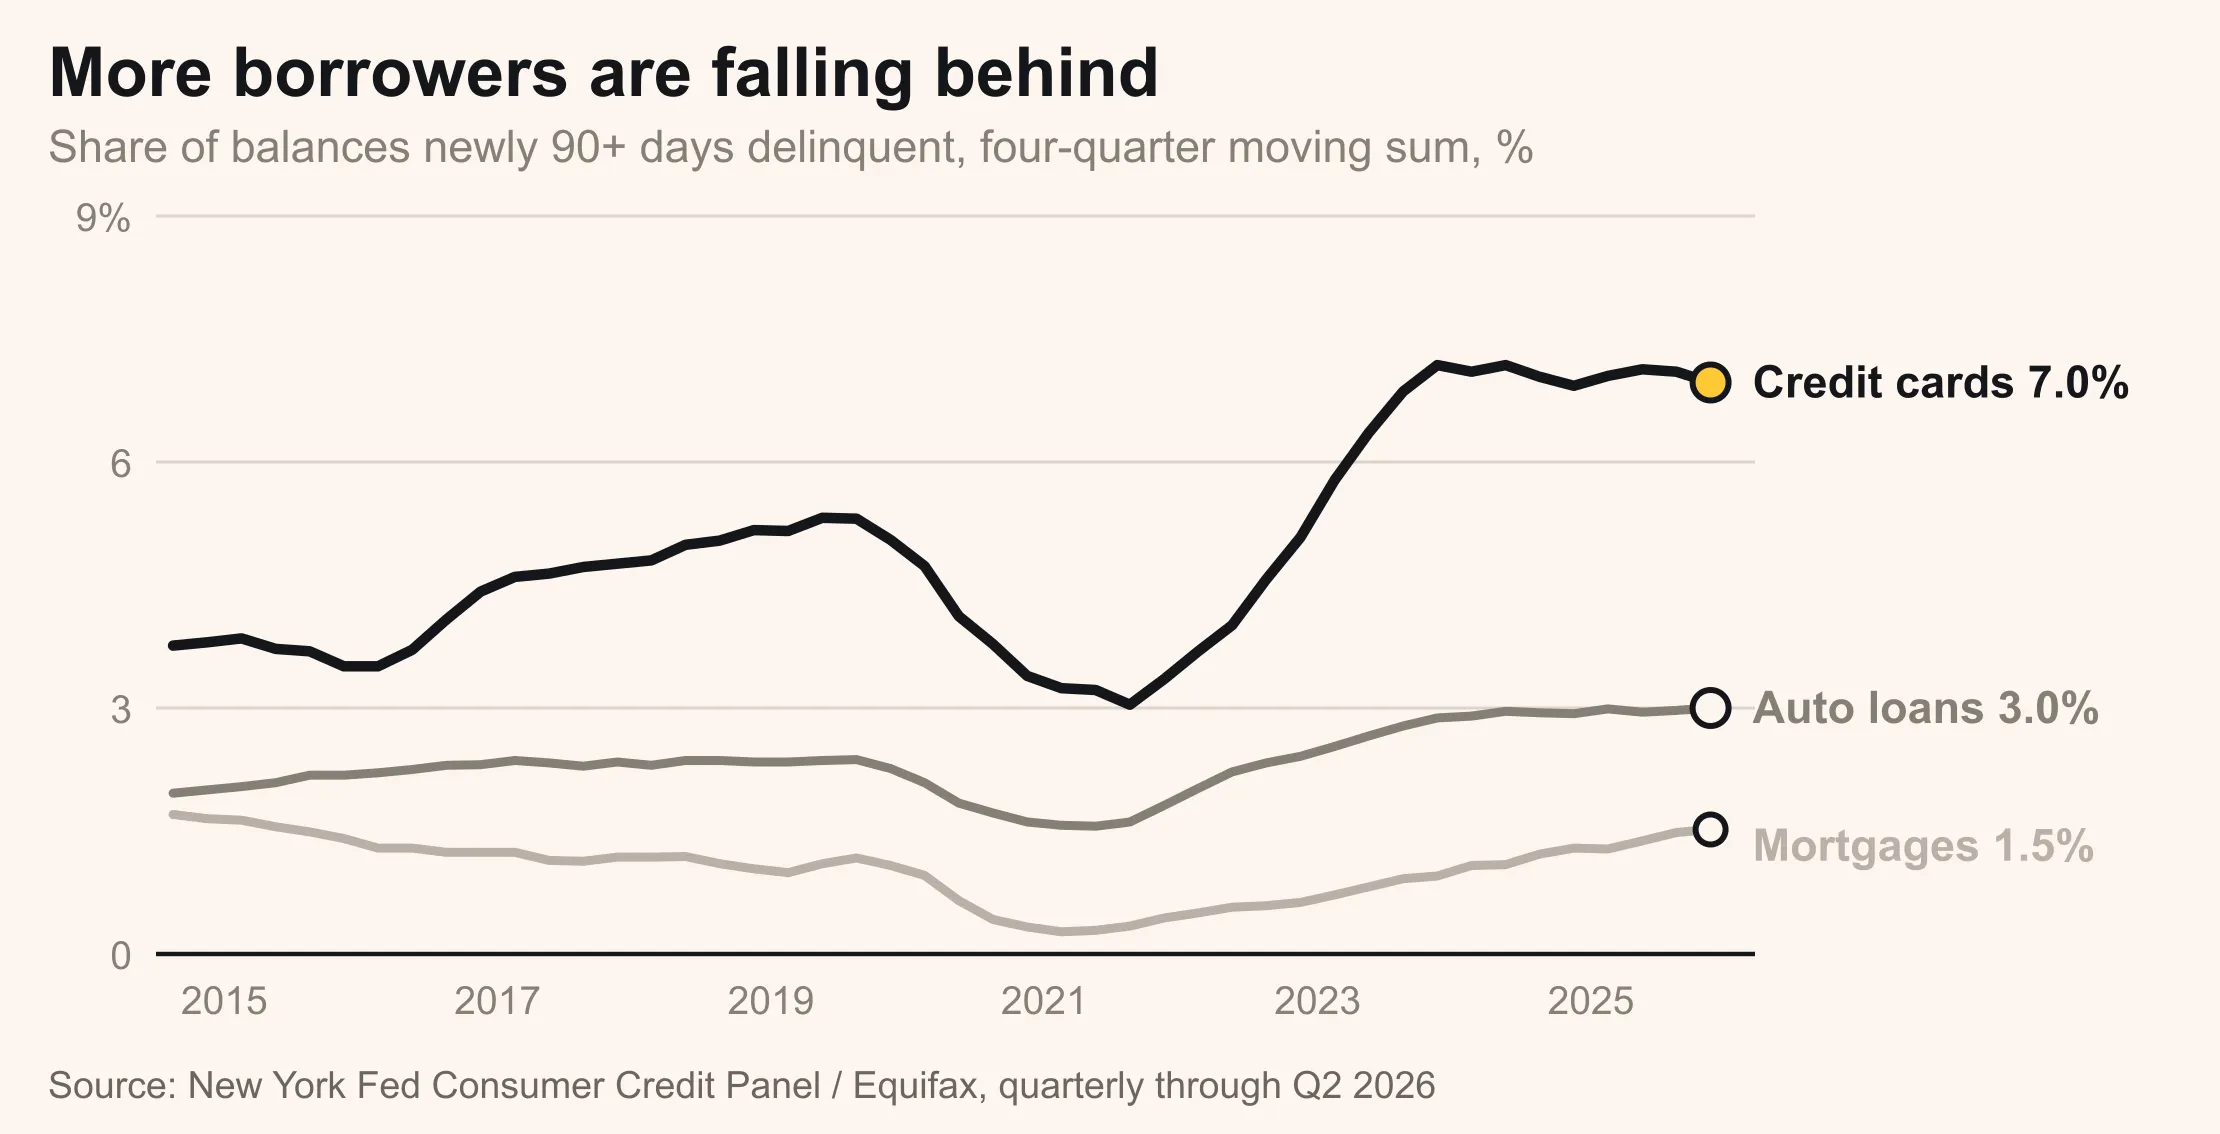
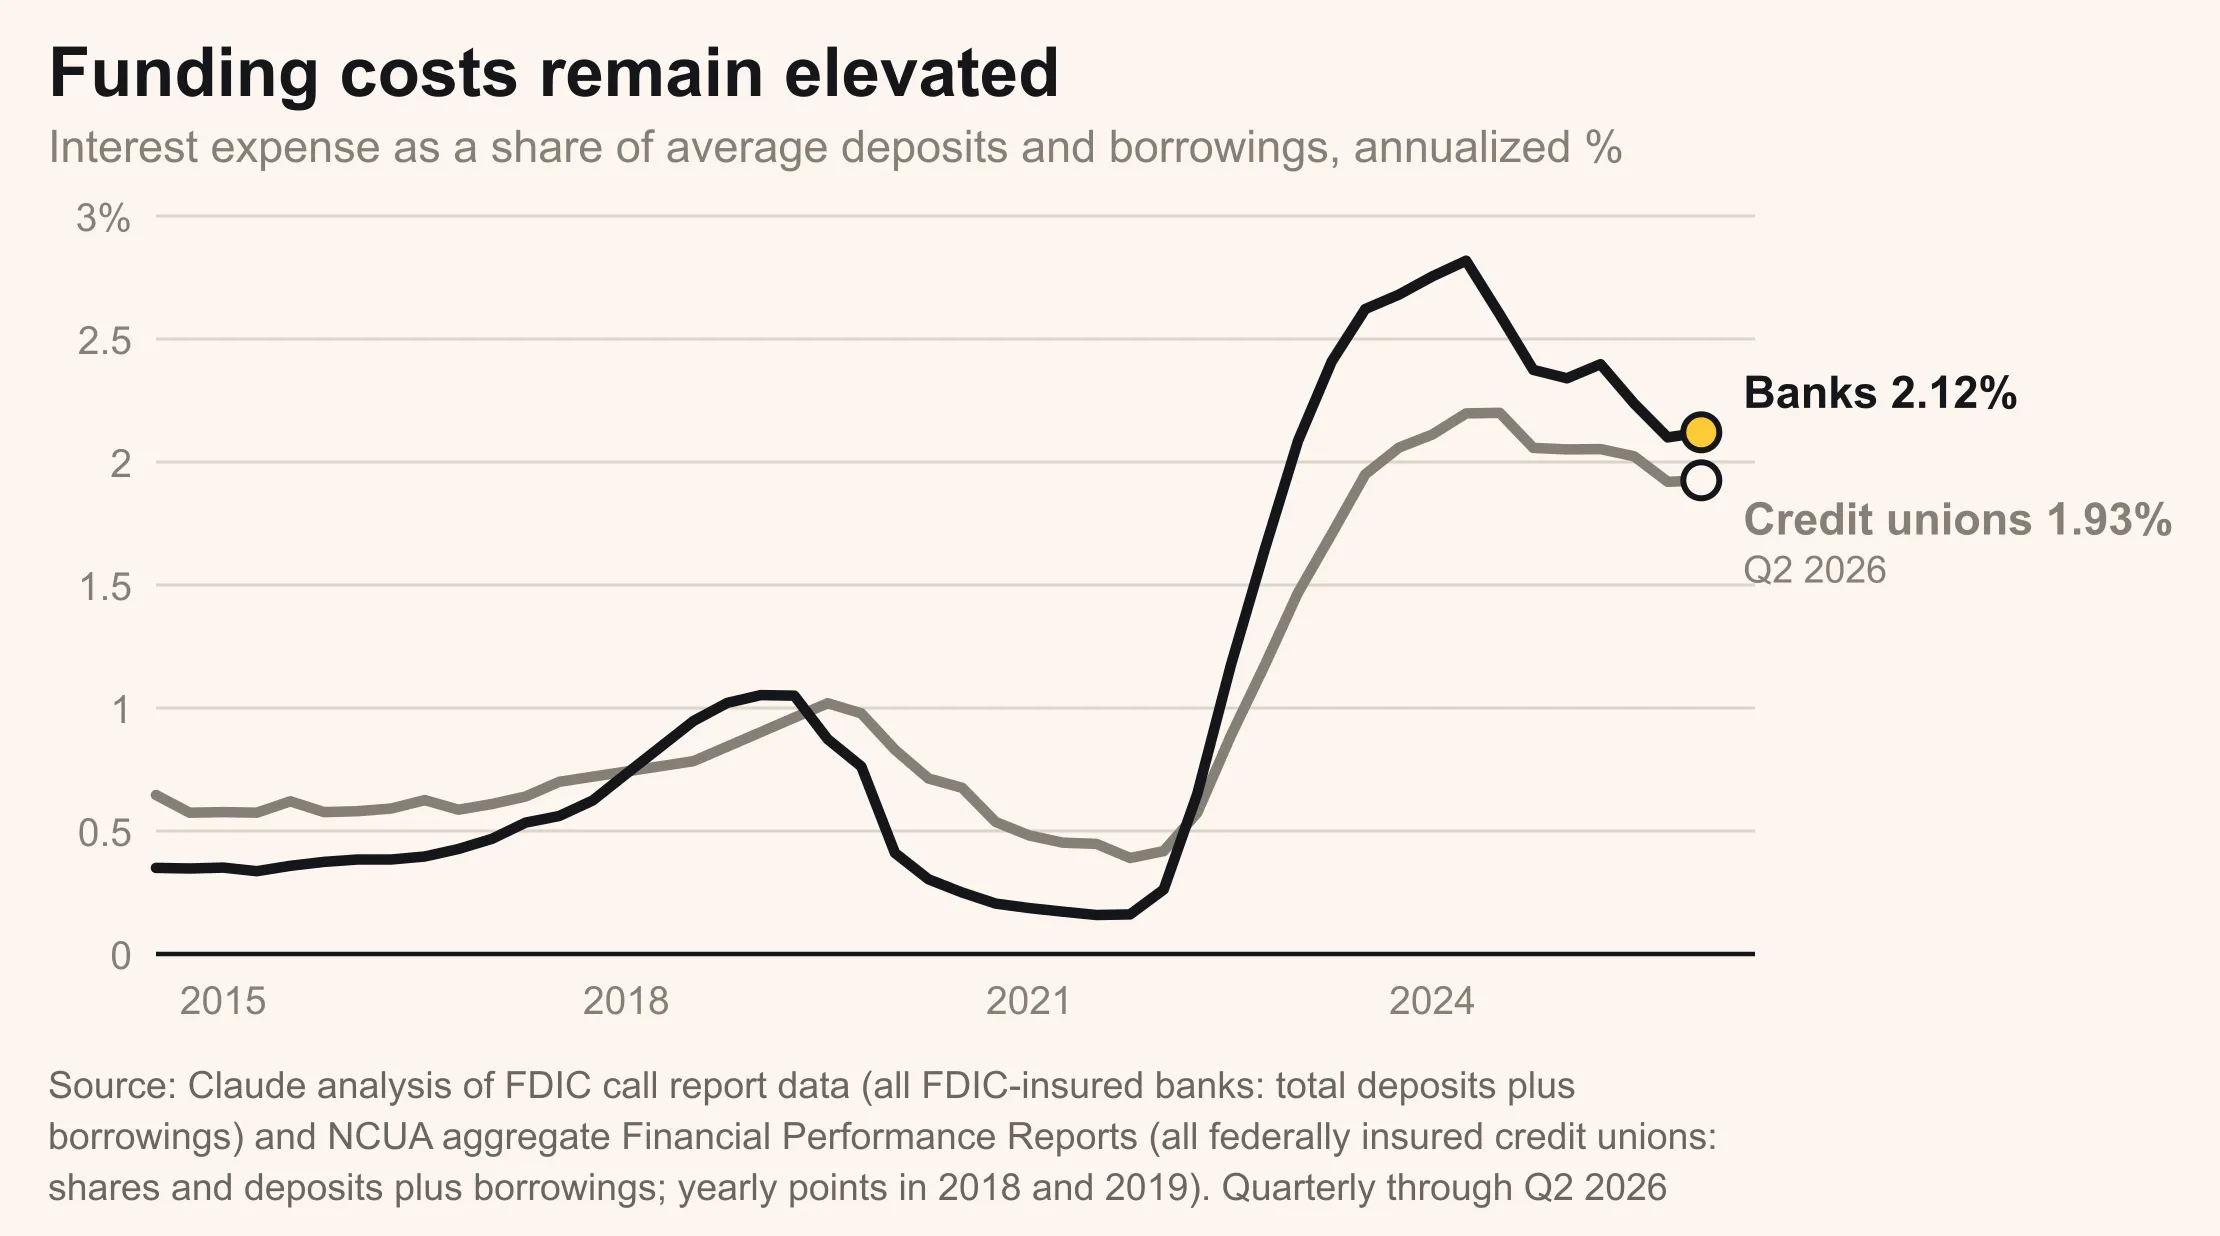
Elevated cost of funding and deteriorating asset quality are going to continue to create balance sheet stress and drive down margin recovery.
We expect the current backdrop of strong growth and accelerating inflation to persist, putting pressure on the Fed to hike. We expect a 25 bps hike at the December meeting.
How prepared is your institution? Contact Delfi for a free consultation on optimizing your balance sheet.